
Keyword
Earth Science | Oceans | Ocean Chemistry | Phosphate
782 record(s)
Type of resources
Topics
Keywords
Contact for the resource
Provided by
Formats
Update frequencies
Status
draft
-
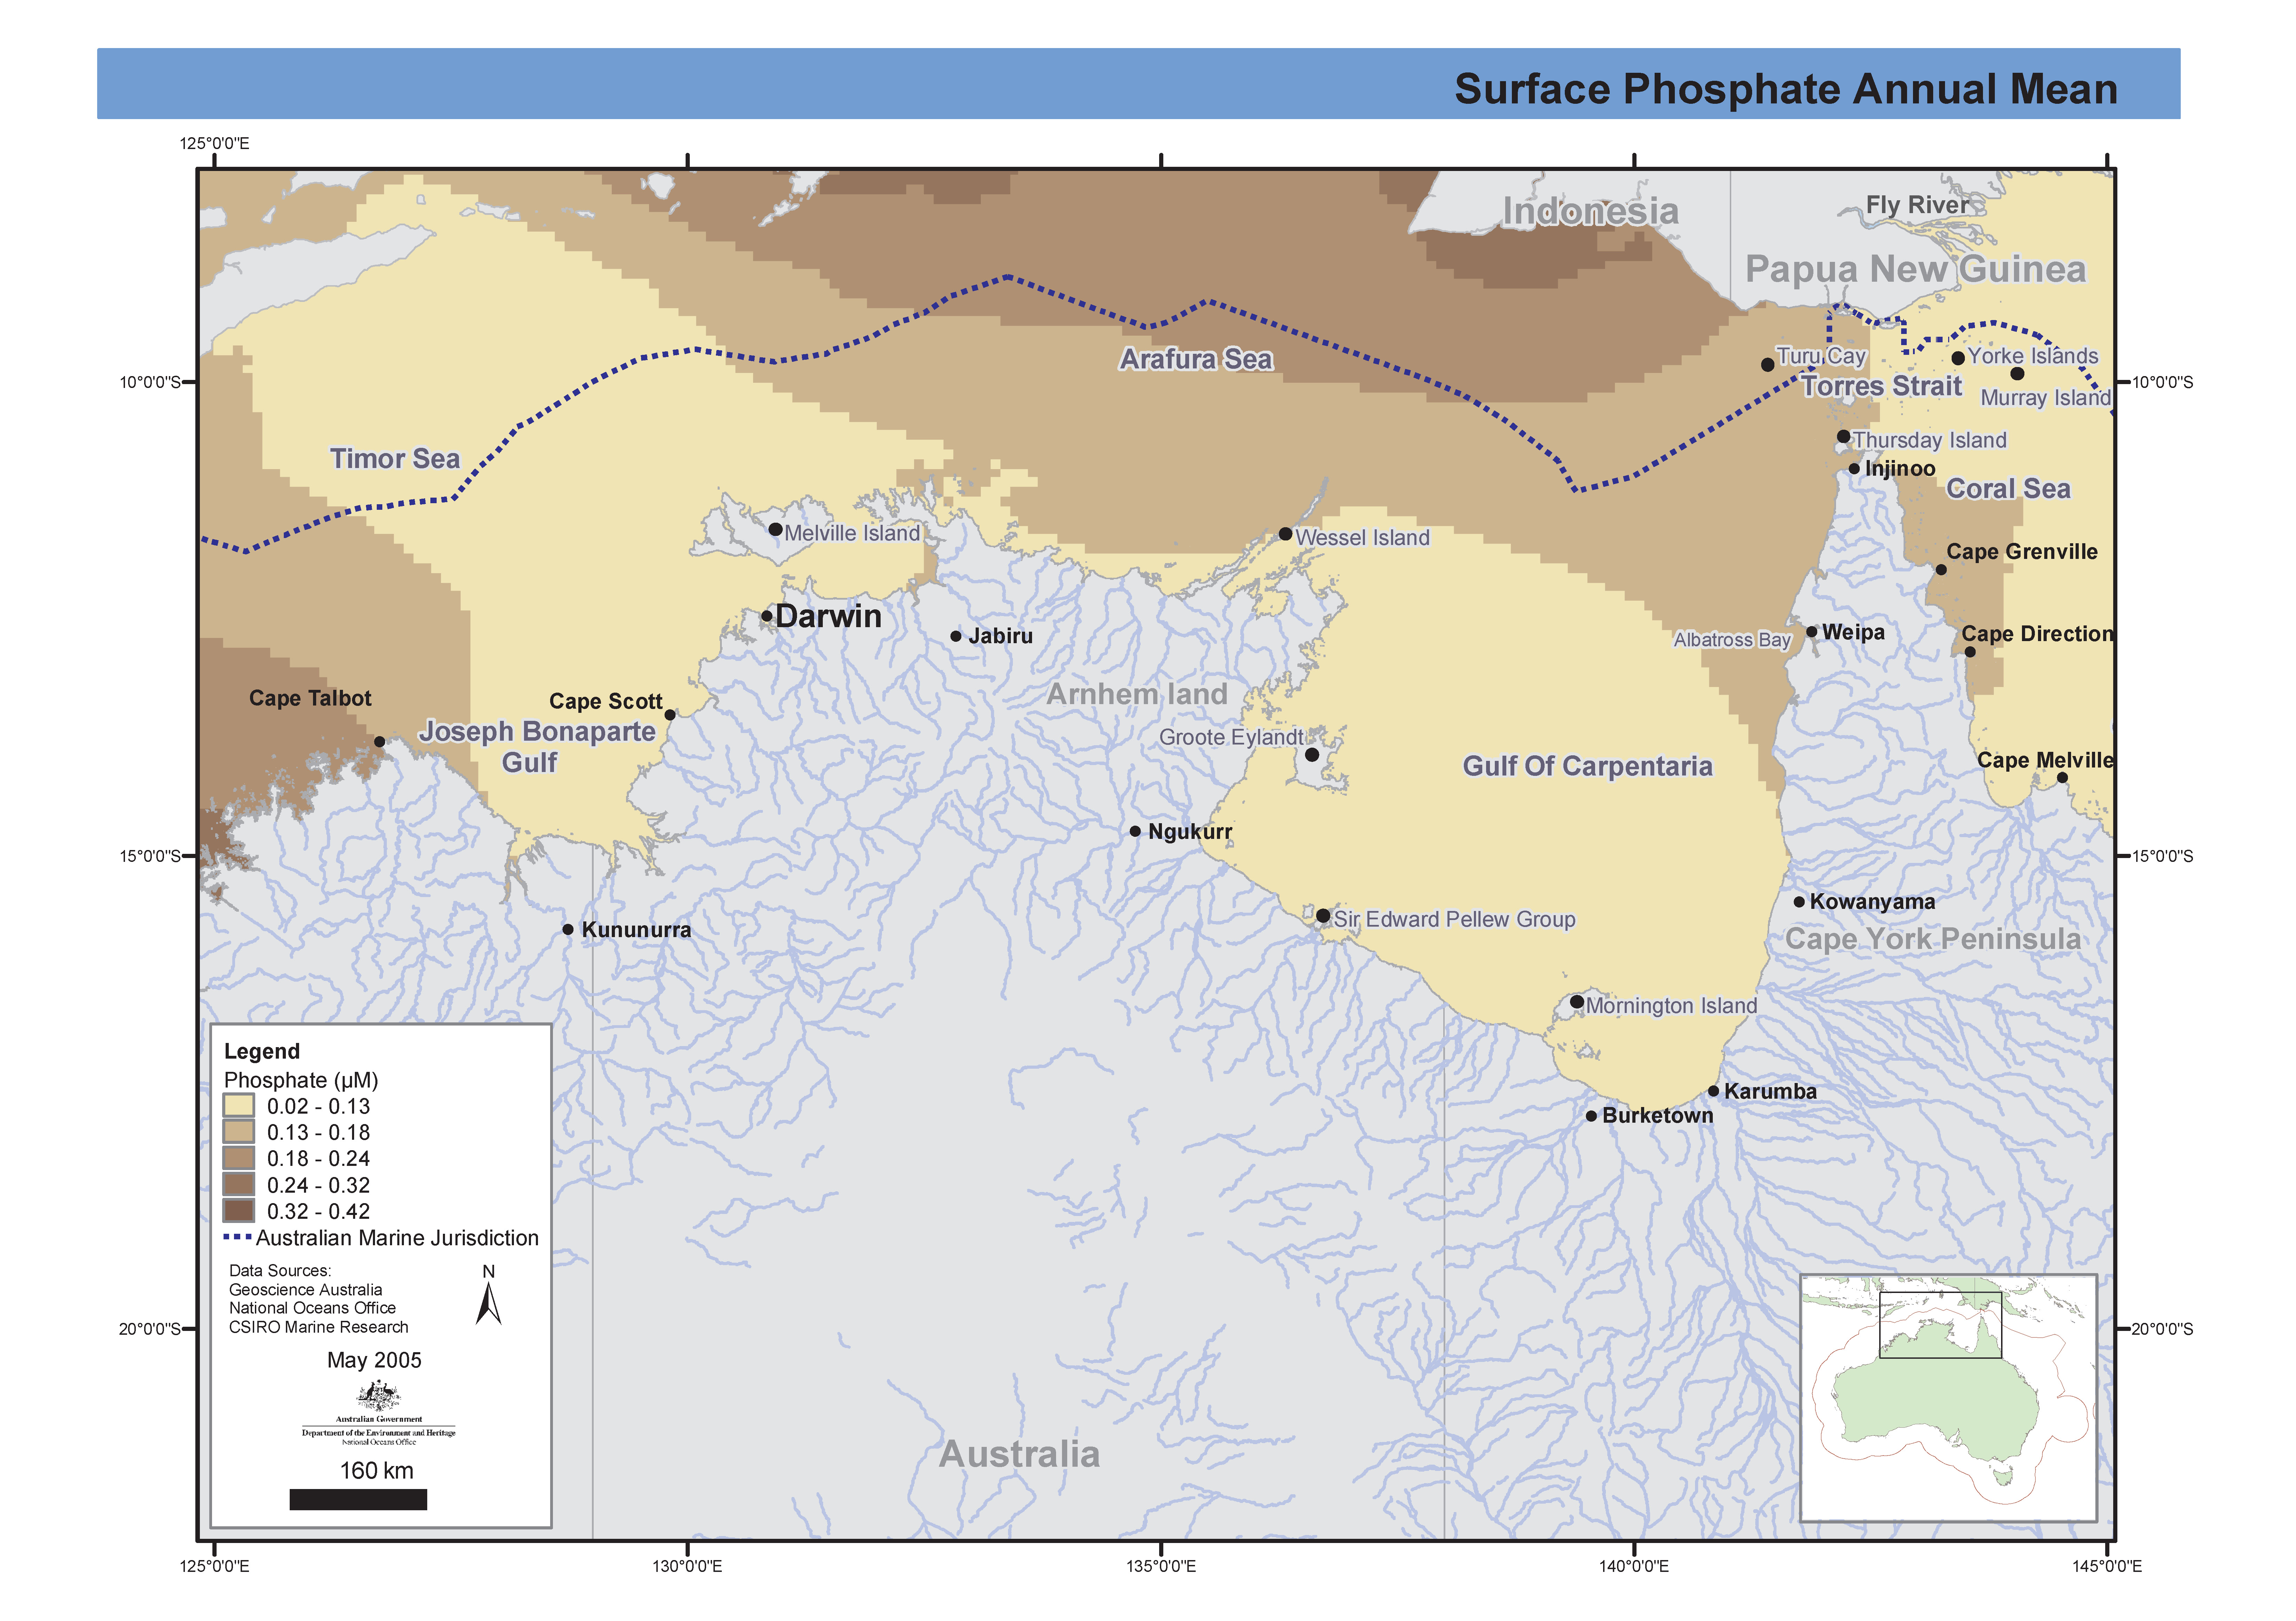
Map of annual mean of phosphate in Northern Marine Region produced from CARS2000 mean and seasonal fields 0.1 degree spaced grid. Phosphate, linearly interpolated from CARS2000 mean and seasonal fields to 0.1 degree spaced grid, at depths of 0, 150, 500, 1000 and 2000 metres. The loess filter used to create CARS2000 resolves at each point a mean value and a sinusoid with 1 year period (and in some cases a 6 month period sinusoid - the "semi-annual cycle".) The provided "annual amplitude" is simply the magnitude of that annual sinusoid.adjacent data points. The loess filter used to create CARS2000 resolves at each point a mean value and a sinusoid with 1 year period (and in some cases a 6 month period sinusoid - the "semi-annual cycle".) The provided "annual amplitude" is simply the magnitude of that annual sinusoid. CARS is a set of seasonal maps of temperature, salinity, dissolved oxygen, nitrate, phosphate and silicate, generated using Loess mapping from all available oceanographic data in the region. It covers the region 100-200E, 50-0S, on a 0.5 degree grid, and on 56 standard depth levels. Higher resolution versions are also available for the Australian continental shelf. The data was obtained from the World Ocean Atlas 98 and CSIRO Marine and NIWA archives. It was designed to improve on the Levitus WOA98 Atlas, in the Australian region. This map has been produced by CSIRO for the National Oceans Office, as part of an ongoing commitment to natural resource planning and management through the 'National Marine Bioregionalisation' project.
-
ESRI grids showing phosphate, linearly interpolated from CARS2000 mean and seasonal fields to 0.1 degree spaced grid, at depths of 0, 150, 500, 1000 and 2000 metres. The loess filter used to create CARS2000 resolves at each point a mean value and a sinusoid with 1 year period (and in some cases a 6 month period sinusoid - the "semi-annual cycle".) The provided "annual amplitude" is simply the magnitude of that annual sinusoid. CARS is a set of seasonal maps of temperature, salinity, dissolved oxygen, nitrate, phosphate and silicate, generated using Loess mapping from all available oceanographic data in the region. It covers the region 100-200E, 50-0S, on a 0.5 degree grid, and on 56 standard depth levels. Higher resolution versions are also available for the Australian continental shelf. The data was obtained from the World Ocean Atlas 98 and CSIRO Marine and NIWA archives. It was designed to improve on the Levitus WOA98 Atlas, in the Australian region. CARS2000 is derived from ocean cast data, which is always measured above the sea floor. However, for properties which do not change rapidly near the sea floor, this would not lead to a significant error. All the limitations of CARS2000 also apply here.
-
Phosphate, linearly interpolated from CARS2000 mean and seasonal fields to 0.1 degree spaced grid, at depths of 0, 150, 500, 1000 and 2000 metres. The loess filter used to create CARS2000 resolves at each point a mean value and a sinusoid with 1 year period (and in some cases a 6 month period sinusoid - the "semi-annual cycle".) The provided "annual amplitude" is simply the magnitude of that annual sinusoid.adjacent data points. The loess filter used to create CARS2000 resolves at each point a mean value and a sinusoid with 1 year period (and in some cases a 6 month period sinusoid - the "semi-annual cycle".) The provided "annual amplitude" is simply the magnitude of that annual sinusoid. CARS is a set of seasonal maps of temperature, salinity, dissolved oxygen, nitrate, phosphate and silicate, generated using Loess mapping from all available oceanographic data in the region. It covers the region 100-200E, 50-0S, on a 0.5 degree grid, and on 56 standard depth levels. Higher resolution versions are also available for the Australian continental shelf. The data was obtained from the World Ocean Atlas 98 and CSIRO Marine and NIWA archives. It was designed to improve on the Levitus WOA98 Atlas, in the Australian region. CARS2000 is derived from ocean cast data, which is always measured above the seafloor. However, for properties which do not change rapidly near the seafloor, this would not lead to a significant error. All the limitations of CARS2000 also apply here.
-
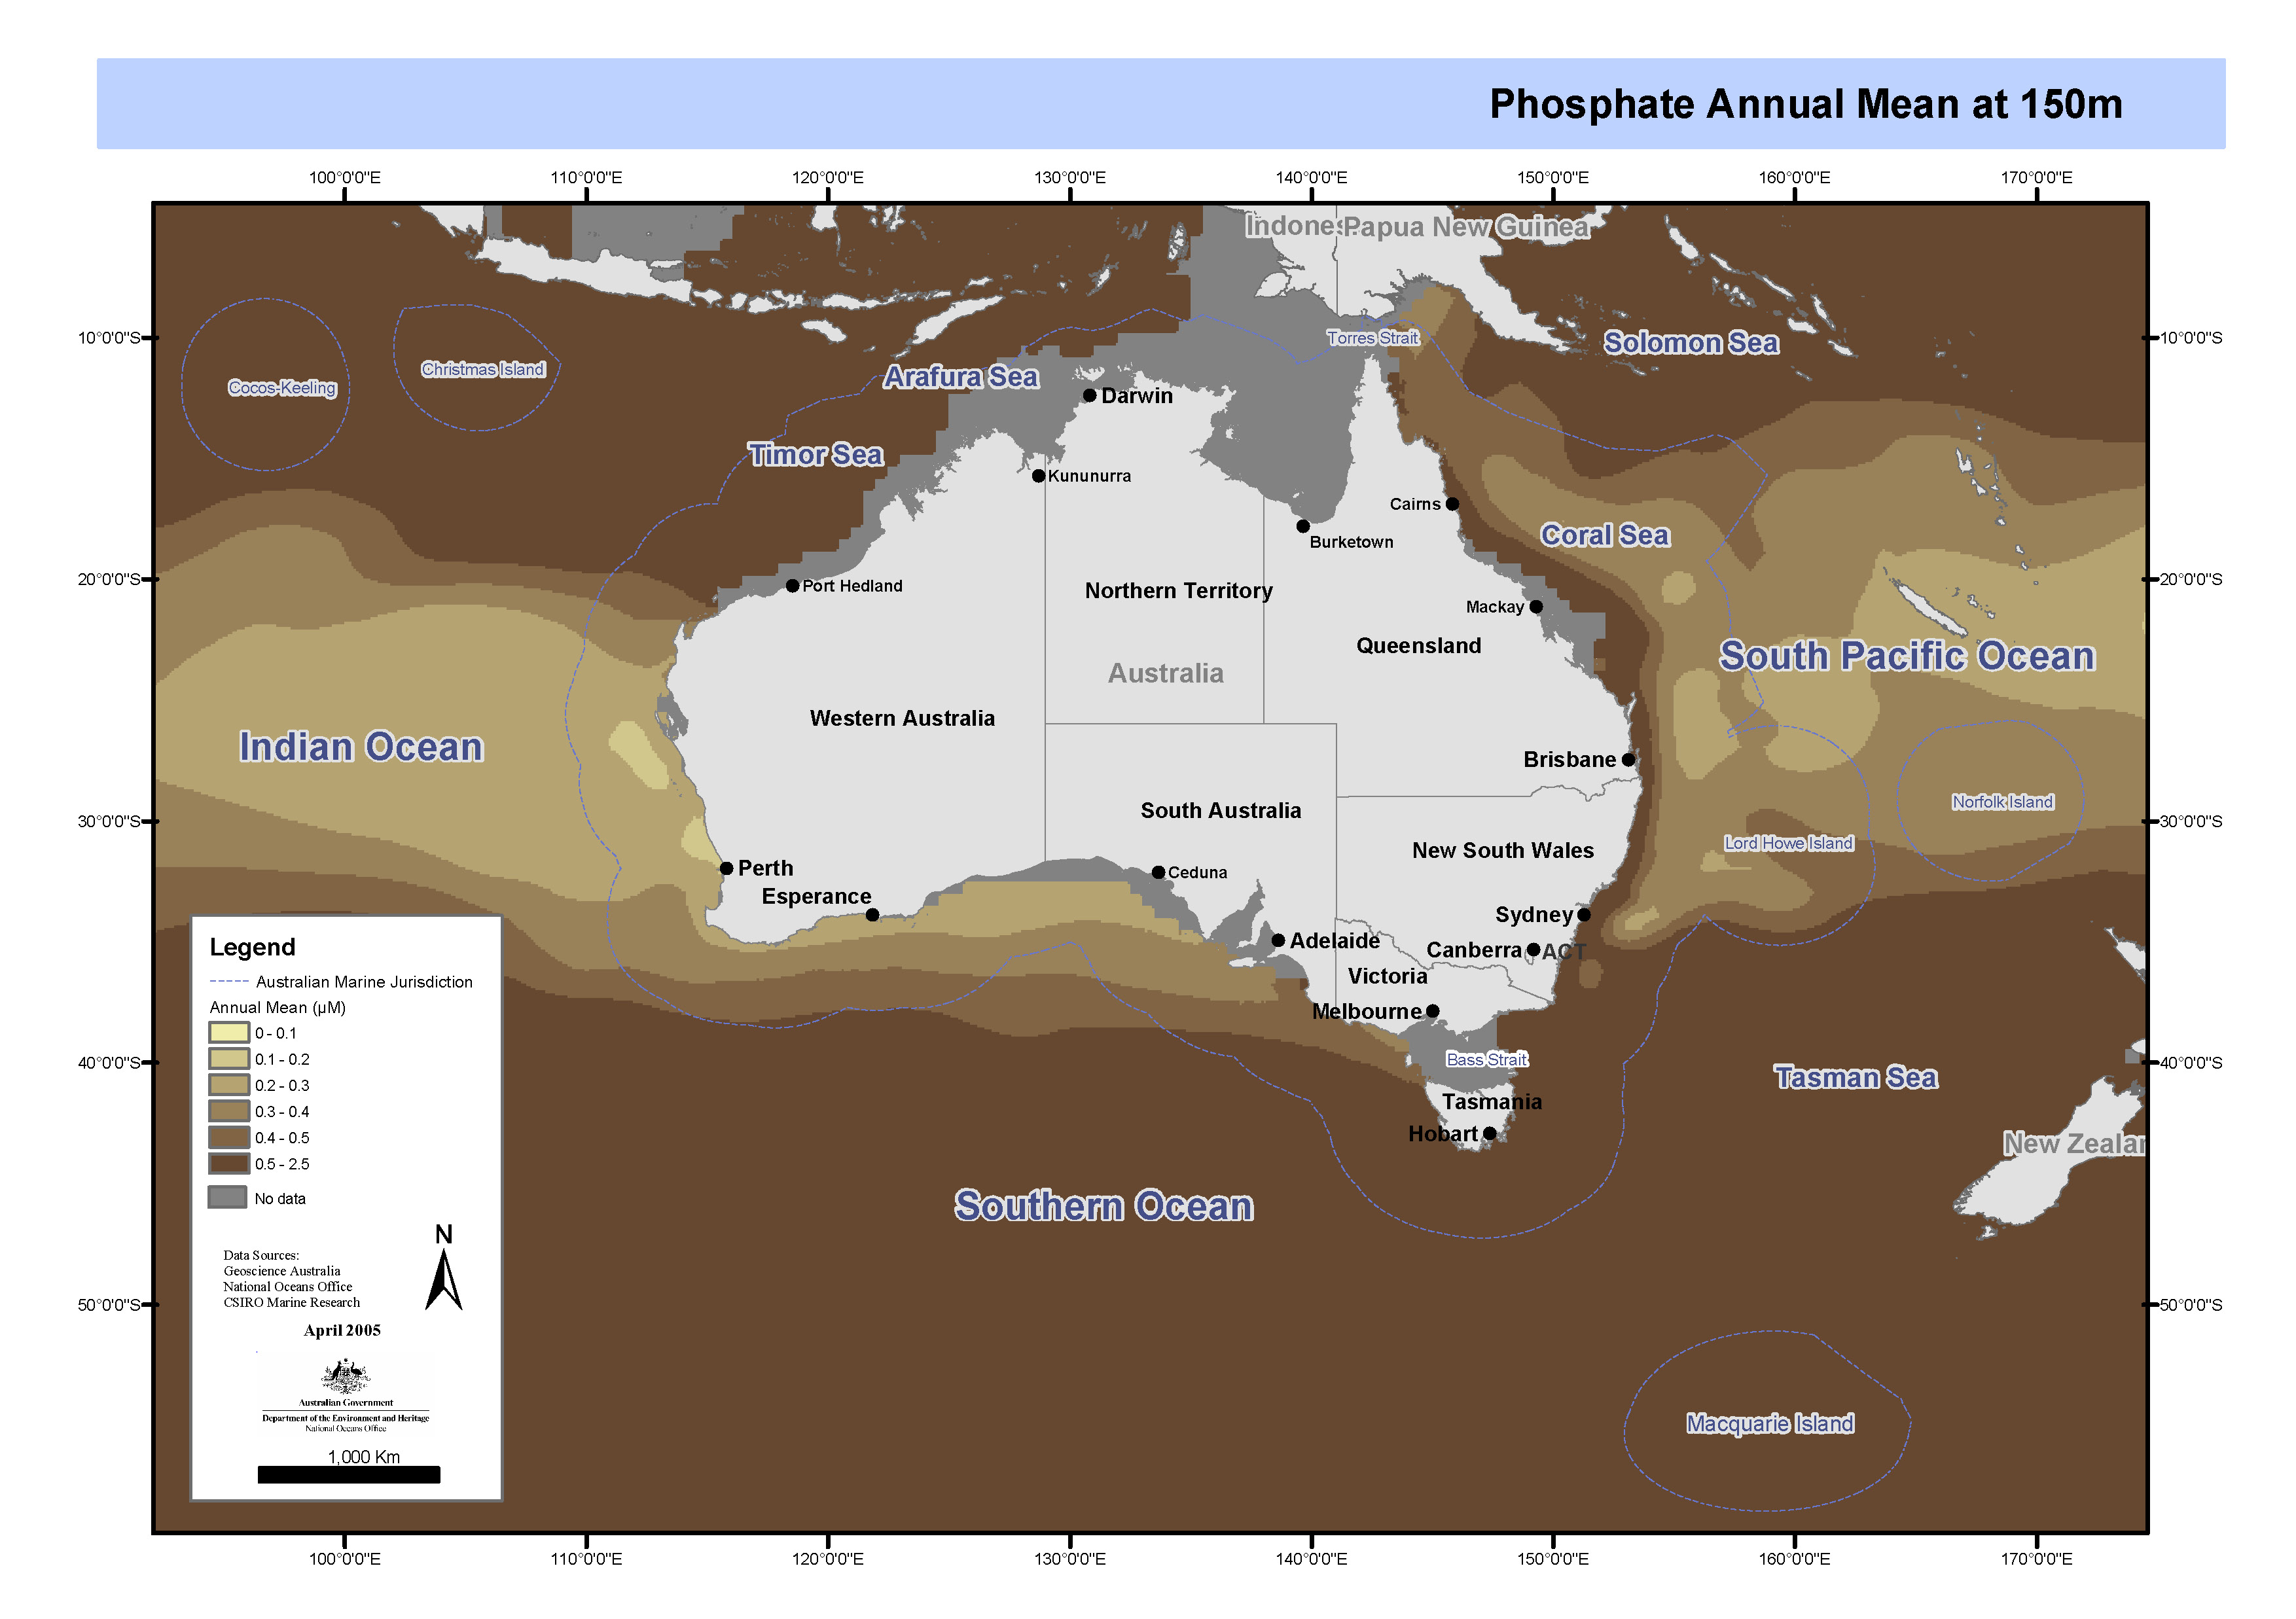
Set of maps showing phosphate by depth linearly interpolated from CARS2000 mean and seasonal fields to 0.1 degree spaced grid. These maps form part of a series of maps showing the variation of temperature, salinity, oxygen, silicate, phosphate, and nitrate in Australia's Oceans. Each feature in the series has been separately mapped at depths of 0, 150, 500, 1000 and 2000 metres. These maps have been produced by CSIRO for the National Oceans Office, as part of an ongoing commitment to natural resource planning and management through the 'National Marine Bioregionalisation' project.
-
These data, reported in various volumes of CSIRO's "Oceanographic Station List" series between 1957 and 1962, comprise mainly measurements of surface temperature, salinity (as chlorinity), and (in later stages) phosphate from sea surface samples collected by merchant ships in Bass Strait and surrounding waters. Vessels contributing t the sampling program include TSS "Taroona" and "Princess of Tasmania, SS "Talune", and MVs "Claire Crouch", "Denman", Century", "Jillian Crouch", "Lorinna", "Marra", "Pateena", "Poolta", "Risdon", and "Wareatea". Sampling began in December 1954 and was still in progress December 1960, the last date for which data were published in this series. The merchant vessel sampling program was carried out at a time when the CSIRO Division of Fisheries had no dedicated ocean-going research vessel, as a means of acquiring information about offshore waters. In the volumes cited, similar data are also reported from the Coral Sea, Tasman Sea, and the south-east Indian Ocean.
-
These data, reported in CSIRO's "Oceanographic Station List" series in 1957, comprise mainly measurements of surface temperature, and salinity (as chlorinity), from sea surface samples collected by the merchant ships MV "Dulverton", MV "Kabbarli" and MV "Duntroon". Sampling was only carried out in one year (1956). The merchant vessel sampling program was carried out at a time when the CSIRO Division of Fisheries had no dedicated ocean-going research vessel, as a means of acquiring information about offshore waters. In the volumes cited, similar data are also reported from the Tasman Sea, Coral Sea, and south-eastern Australian waters and Bass Strait.
-
These data, reported in various volumes of CSIRO's "Oceanographic Station List" series between 1955 and 1962, comprise mainly measurements of surface temperature, salinity (as chlorinity), and (in later stages) phosphate from sea surface samples collected by the merchant ship TSMV "Wanganella" on regular runs between Sydney and Auckland or Wellengton, New Zealand. Sampling began in December 1952 and was still in progress December 1960, the last date for which data were published in this series. The merchant vessel sampling program was carried out at a time when the CSIRO Division of Fisheries had no dedicated ocean-going research vessel, as a means of acquiring information about offshore waters. In the volumes cited, similar data are also reported from the Coral Sea, south-eastern Australian waters and Bass Strait, and the south-east Indian Ocean.
-
These data, reported in various volumes of CSIRO's "Oceanographic Station List" series between 1957 and 1962, comprise mainly measurements of surface temperature, salinity (as chlorinity), and (in later stages) phosphate from sea surface samples collected by the merchant ships MV "Tulagi" and MV "Malaita" on regular runs between Australia's east coast and New Caledonia via Norfolk Island ("Tulagi") and New Guinea ("Malaita"). Sampling began in 1955 and was still in progress December 1960, the last date for which data were published in this series. The merchant vessel sampling program was carried out at a time when the CSIRO Division of Fisheries had no dedicated ocean-going research vessel, as a means of acquiring information about offshore waters. In the volumes cited, similar data are also reported from the Tasman Sea, south-eastern Australian waters and Bass Strait, and the south-east Indian Ocean.
-

This dataset contains temperature, salinity and nutrient data collected off Marmion, Perth, Western Australia between June 1979 and June 1982. 33 surveys were carried out at approximately monthly intervals on transects and/or grid surveys in this region. Nutrients measured comprise nitrate, reactive silicate, inorganic phosphate, nitrite, and dissolved organic phosphate (DOP). Observations on weather conditions and water quality accompany the printed version of the data. The surveys were undertaken to obtain baseline information for the Division of Fisheries & Oceanography Coastal Ecology research program established at Marmion in the late 1970s. Full listings of the surveys and results are presented in the documentation. The locations of the sampling stations are indicated in the attached map (see "Links" section).
-
NetCDF version of the NODC World Ocean Atlas 2005 (Climate and Forecasting Metadata conventions conforming) to supply the CSIRO and broader scientific community with a machine transparent, portable and self-describing version of the World Ocean Atlas 2005 (National Oceanographic Data Centre, 2006; Locarnini et al., 2006; Antonov et al., 2006; Garcia et al.,2006a,b) dataset. This Atlas is referred to by the National Oceanographic Data Center (NODC - http://www.nodc.noaa.gov) with the identifier WOA05. NODC offers the WOA05 in ASCII text format that is highly portable but not generally compact, self-describing or very efficient for processing and visualising. The ASCII or netCDF version of the WOA05 can be used to initialise numerical models, verify numerical model solutions, or for general oceanographic and meteorological analysis and can be imported into most plotting and analysis tools, or numerical models, that can read netCDF files. Contains temporal and spatial representation of in-situ temperature, salinity, oxygen and dissolved inorganic nutrients at 1 X 1 deg resolution with standard levels for the analysed fields of 0, 10, 20, 30, 50, 75, 100, 125, 150, 200, 250, 300, 400, 500, 600, 700, 800, 900, 1000, 1100, 1200, 1300, 1400, 1500, 1750, 2000, 2500, 3000, 3500, 4000, 4500, 5000 and 5500 metres.